Rによるデータクリーニング実践をPython(Pandas)でやってみた

Pandasでは不要な処理も多いため別途作成しました imabari.hateblo.jp

参考

id.fnshr.info

Rによるデータクリーニング実践をPython(Pandas)でやってみた

!pip install japanize_matplotlib

スクレイピング

www.e-stat.go.jp

「男女別学校数 -後期課程」で検索、調査年月を降順で並べて1ページ目の50件取得

import requests
from bs4 import BeautifulSoup
from urllib.parse import urljoin

headers = {
    "User-Agent": "Mozilla/5.0 (Windows NT 10.0; WOW64; Trident/7.0; rv:11.0) like Gecko"
}

r = requests.get(
    "https://www.e-stat.go.jp/stat-search/files?page=1&query=%E7%94%B7%E5%A5%B3%E5%88%A5%E5%AD%A6%E6%A0%A1%E6%95%B0%20-%E5%BE%8C%E6%9C%9F%E8%AA%B2%E7%A8%8B&sort=year_month%20desc&layout=dataset&toukei=00400001&metadata=1&data=1",
    headers=headers,
)

r.raise_for_status()

soup = BeautifulSoup(r.content, 'html5lib')

data = []

# ExcelファイルのURLと調査年月日を取得
for div in soup.select("div.stat-resource_list-main"):
    li = div.select("li.stat-resource_list-detail-item")

    data.append(
        {
            "year": int(li[2].contents[2].rstrip("年")),
            "url": urljoin(
                "https://www.e-stat.go.jp/",
                li[4].find("a", attrs={"data-file_type": "EXCEL"}).get("href"),
            ),
        }
    )

データ処理

import pandas as pd
from tqdm import tqdm_notebook
import time

dfs = []

for i in tqdm_notebook(data):

    df0 = pd.read_excel(i["url"])

    df0 = df0.replace(["-", "―", "-"], 0, inplace=True)

    # 欠損値でない列が2個より多い行を抽出
    df1 = df0[df0.notnull().sum(axis=1) > 2].copy()

    # 空列を削除
    df1.dropna(how="all", axis=1, inplace=True)

    # 列名用に値を変更
    df1.iat[0, 0] = "設置者"
    df1.iat[1, 0] = "本校分校"

    # 転置
    df1t = df1.T
    df1t

    # 1行目を列名に設定
    df1t.rename(columns=df1t.iloc[0], inplace=True)

    # 1行目を削除
    df2 = df1t.iloc[1:, :].copy()

    # 空白文字を除去、欠損値を前から補完
    df2["設置者"] = df2["設置者"].str.replace(r"\s", "").fillna(method="ffill")

    # 横持ちから縦持ちへ変換
    df3 = pd.melt(df2, id_vars=["設置者", "本校分校"])

    # 列名変更
    df3.rename(columns={"variable": "男女", "value": "学校数"}, inplace=True)

    # 計の行を全削除、indexリセット
    df4 = df3[df3 != "計"].dropna(how="any").reset_index(drop=True)

    # 整数に型変更
    df4["学校数"] = df4["学校数"].astype(int)

    # 年を追加
    df4["年"] = i["year"]

    # 1からの連番に変更
    df4.index += 1

    dfs.append(df4)

    time.sleep(3)

# 全データを結合
df = pd.concat(dfs)

df

グラフ表示

import matplotlib.pyplot as plt
import japanize_matplotlib
import numpy as np

pv = df.pivot_table(index="年", columns="男女", aggfunc="sum").droplevel(0, axis=1)

pv.plot(
    y=["男のみの学校", "女のみの学校"],
    marker="o",
    ms=5,
    grid=True,
    figsize=(10, 8),
    xticks=np.arange(int(pv.index.min()), int(pv.index.max()), 5),
)
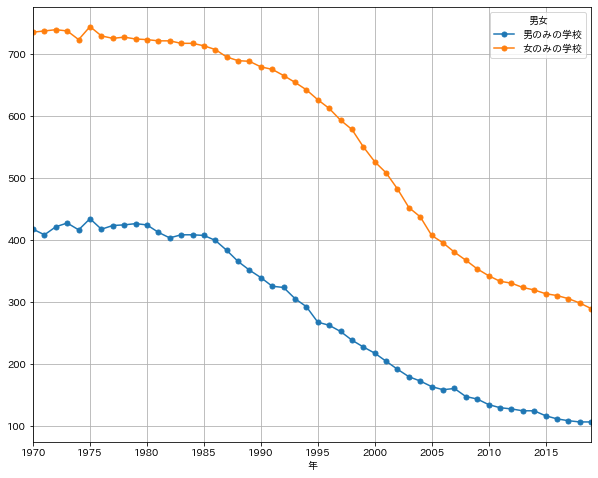
f:id:imabari_ehime:20200107135511p:plain

Pythonでテキスト読み上げ(Windows10)

orebibou.com

Powershellから.NETのSpeechSynthesizerを利用してテキスト読み上げ

  1. speech.ps1をファイルに保存
  2. PythonからPowershellにテキストを送りテキスト読み上げ

speech.ps1

Param(
    [String]$Arg1= "テキストがありません"
)

Add-Type -AssemblyName System.speech

$s = New-Object System.Speech.Synthesis.SpeechSynthesizer
$s.Speak($Arg1)

Python

import os


def say(text):
    """
    Powershellから.NETのSpeechSynthesizerを利用してテキスト読み上げ

    Parameters
    ----------
    text : str
        
    """
    print(text)

    os.system(
        rf'powershell -NoProfile -ExecutionPolicy Unrestricted .\speech.ps1 -Arg1 "{text}"'
    )

if __name__ == "__main__":
    say("テスト")

小田急バスの位置情報をスクレイピング

qiita.com

import datetime
import requests
from bs4 import BeautifulSoup

# timedeltaを%H:%Mに変換
def time_str(t):
    return ':'.join(str(t).split(':')[:2])

if __name__ == "__main__":

    出発 = ""
    到着 = ""

    url = f"https://odakyu.bus-navigation.jp/wgsys/wgs/bus.htm?tabName=searchTab&selectedLandmarkCatCd=&from={出発}&fromType=1&to={到着}&toType=1&locale=ja&fromlat=&fromlng=&tolat=&tolng=&fromSignpoleKey=&routeLayoutCd=&bsid=1&fromBusStopCd=&toBusStopCd=&mapFlag=false&existYn=N&routeKey=&nextDiagramFlag=&diaRevisedDate=&timeTableDirevtionCd="

    headers = {
        "User-Agent":
        "Mozilla/5.0 (Windows NT 10.0; WOW64; Trident/7.0; rv:11.0) like Gecko"
    }

    r = requests.get(url, headers=headers)

    r.raise_for_status()

    soup = BeautifulSoup(r.content, "html5lib")

    s = soup.select_one('div[style="background-color: gold;"] > table:nth-of-type(2) > tbody > tr:nth-of-type(2) > td:nth-of-type(2)')

    if s:
        _, d = s.get_text(strip=True).split()
        h, m = map(int, d.split(":"))

        # 発車予測
        td_dep = datetime.timedelta(hours=h, minutes=m)

        # 現在の時間
        dt_now = datetime.datetime.now(datetime.timezone(datetime.timedelta(hours=9)))
        td_now = datetime.timedelta(hours=dt_now.hour, minutes=dt_now.minute)

        td = time_str(td_dep - td_now)

        print(f"Next bus in {td}")
        print(f"Next bus@ {d}")

    else:
        print("接近しているバスはありません。")

Excel×Python最速仕事術

Excel×Python最速仕事術

Excel×Python最速仕事術

ec.nikkeibp.co.jp

  • 内容は初心者向け
  • Pythonだと保存すると書式がくずれたような?
  • 他人に使ってもらう場合はPowershellの方がいい

imabari.hateblo.jp

imabari.hateblo.jp

imabari.hateblo.jp

imabari.hateblo.jp

imabari.hateblo.jp

新幹線の空席情報をスクレイピング

rfushimi.hatenablog.jp

import datetime
import os
import time

import requests
from bs4 import BeautifulSoup


def say(text):
    print(text)

    os.system(
        rf'powershell -NoProfile -ExecutionPolicy Unrestricted .\speech.ps1 -Arg1 "{text}"'
    )


url = "http://www1.jr.cyberstation.ne.jp/csws/Vacancy.do"

headers = {
    "User-Agent": "Mozilla/5.0 (Windows NT 10.0; WOW64; Trident/7.0; rv:11.0) like Gecko",
    "Referer": "http://www1.jr.cyberstation.ne.jp/csws/VacancyReinput.do",
}

# 日付
dt = datetime.date(2020, 1, 7)

# 時間範囲
time_range = range(6, 15)

payload = {
    "script": 1,
    "month": dt.month,
    "day": dt.day,
    "hour": "06",
    "minute": "00",
    "train": 1,
    "dep_stn": "福山",
    "arr_stn": "東京",
    "dep_stnpb": 6220,
    "arr_stnpb": 4000,
}

for i in time_range:

    payload["hour"] = f"{i:02}"

    try:
        r = requests.post(url, headers=headers, data=payload)

    except:
        time.sleep(10)
        continue

    soup = BeautifulSoup(r.content, "html.parser")

    table = soup.find(
        "table",
        attrs={"width": "550", "cellspacing": "1", "border": "3", "bgcolor": "#ffffff"},
    )

    for tr in table.find_all("tr", recursive=False)[2:-1]:

        tds = [td.get_text(strip=True) for td in tr.find_all("td")]

        if tds[3] != "×":
            say(f"普通車に空席があります: {tds[1]}, {tds[0]}")

        if tds[5] != "×":
            say(f"グリーン車に空席があります: {tds[1]}, {tds[0]}")

    time.sleep(5)

speech.ps1

Param(
    [String]$Arg1= "テキストがありません"
)

Add-Type -AssemblyName System.speech

$s = New-Object System.Speech.Synthesis.SpeechSynthesizer
$s.Speak($Arg1)

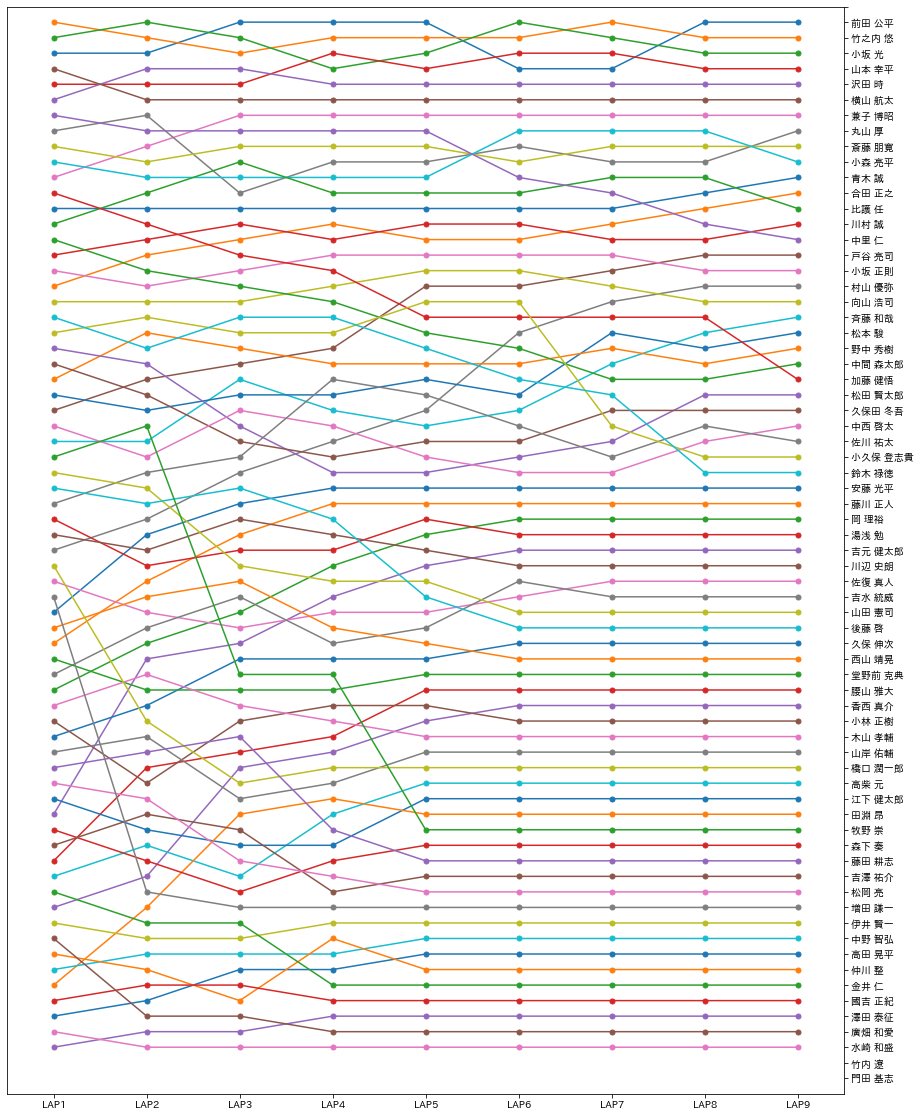
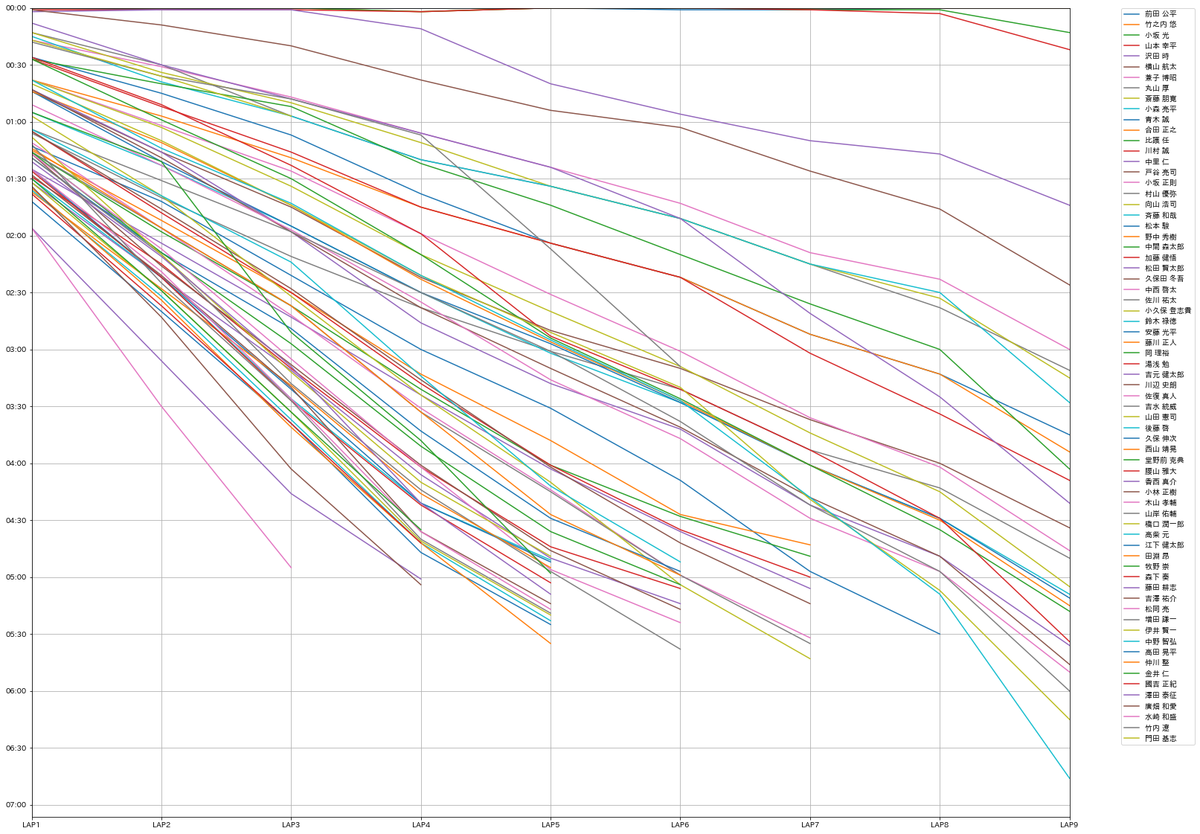
第25回シクロクロス全日本選手権大会 内子大会の順位・ラップタイムをグラフ化

  • 第25回シクロクロス全日本選手権大会 内子大会の順位・ラップタイムをグラフ化したんだけど微妙に違う
  • 3つ目のラップタイム差の計算方法がよくわからないのでパス

PDF

http://wakitasoft.com/Timing/Results/2019/20191208/lap_Result01.pdf

TSV

drive.google.com

import pandas as pd

import japanize_matplotlib
import matplotlib.pyplot as plt
import matplotlib.ticker as ticker

df = pd.read_csv("uchiko2019.tsv", sep="\t")
df

df1 = df.iloc[:, [2, 28, 29, 30, 31, 32, 33, 34, 35, 36]].copy()

df1.columns = [
    "名前",
    "LAP1",
    "LAP2",
    "LAP3",
    "LAP4",
    "LAP5",
    "LAP6",
    "LAP7",
    "LAP8",
    "LAP9",
]

df1.set_index("名前", inplace=True)

# 欠損値の場合は前の順位で補完
df1.fillna(method="ffill", axis=1, inplace=True)

df1

ax = df1.T.plot(
    figsize=(15, 20), xlim=(-0.5, 8.5), ylim=(70, 0), marker="o", ms=5, legend=False
)

# Y軸のラベルに名前を表示
ax.set_yticklabels(["", *df1.index, ""])

# Y軸のラベルを右側に変更
ax.yaxis.tick_right()
ax.set_yticks(list(range(70)))
plt.show()

# トップとのタイム差
df2 = df.iloc[:, [2, 10, 11, 12, 13, 14, 15, 16, 17, 18]].copy()
df2.set_index("名前", inplace=True)

df2

# 文字列のフォーマットをH:M:S形式に揃える
df3 = df2.applymap(
    lambda d: ":".join(("0:" + d).split(":")[-3:]) if pd.notna(d) else ""
)

# 文字列をTimeDelta型に変換
df3 = df3.apply(pd.to_timedelta)

df3.head(10)

df3.dtypes

# トップとのタイム差計算
df3_diff = df3.apply(lambda x: x - x.min())

df3_diff

# グラフ表示
ax = df3_diff.T.plot(figsize=(25, 20), grid=True)


@ticker.FuncFormatter
def yfmt(y, pos):
    m = int(y // (1000000000 * 60))
    s = int((y // 1000000000) - (m * 60))
    return f"{m:02d}:{s:02d}"

# Y軸の目盛を0:30ごと
ax.yaxis.set_major_locator(ticker.MultipleLocator(1000000000 * 30))

# Y軸の目盛のフォーマット
ax.yaxis.set_major_formatter(yfmt)

# 0からスタート
ax.set_ylim(bottom=0)

# Y軸反転
ax.invert_yaxis()
plt.legend(bbox_to_anchor=(1.05, 1), loc="upper left", borderaxespad=0, fontsize=10)

plt.show()

順位

f:id:imabari_ehime:20191227223322p:plain

トップとの差

f:id:imabari_ehime:20191227223333p:plain