qiita.com
import requests
from bs4 import BeautifulSoup
import time

url = "https://produce101.jp/rank/"

headers = {
    "User-Agent":
    "Mozilla/5.0 (Windows NT 10.0; WOW64; Trident/7.0; rv:11.0) like Gecko"
}
週リストを作成
r = requests.get(url, headers = headers)
soup = BeautifulSoup(r.content, "html5lib")
hrefs = [i.get("value") for i in soup.select("select#select > option")]
各週のランキング取得
result = []
with requests.Session() as s:
for href in hrefs:
link = url + href
week = int(href.replace("?week=", ""))
r = s.get(link, headers = headers)
soup = BeautifulSoup(r.content, "html5lib")
ranks = [int(i.get_text(strip = True)) for i in soup.select("span.icon-rank")]
names = [i.text.replace("※辞退", "").strip() for i in soup.select("div.name > a")]
result.extend([{"week" : week, "name" : n, "rank" : r} for r, n in zip(ranks, names)])
time.sleep(1)
ランキングチャート作成
import pandas as pd
import japanize_matplotlib
df = pd.DataFrame(result)
df1 = pd.pivot_table(df, index = "name", columns = "week", values = "rank")
df1.sort_values(by = df1.columns[0], inplace=True)
df1
df2 = df1.dropna(axis = 0, how = 'any').copy()
df2.sort_values(by=df2.columns[-1], inplace=True)
df2
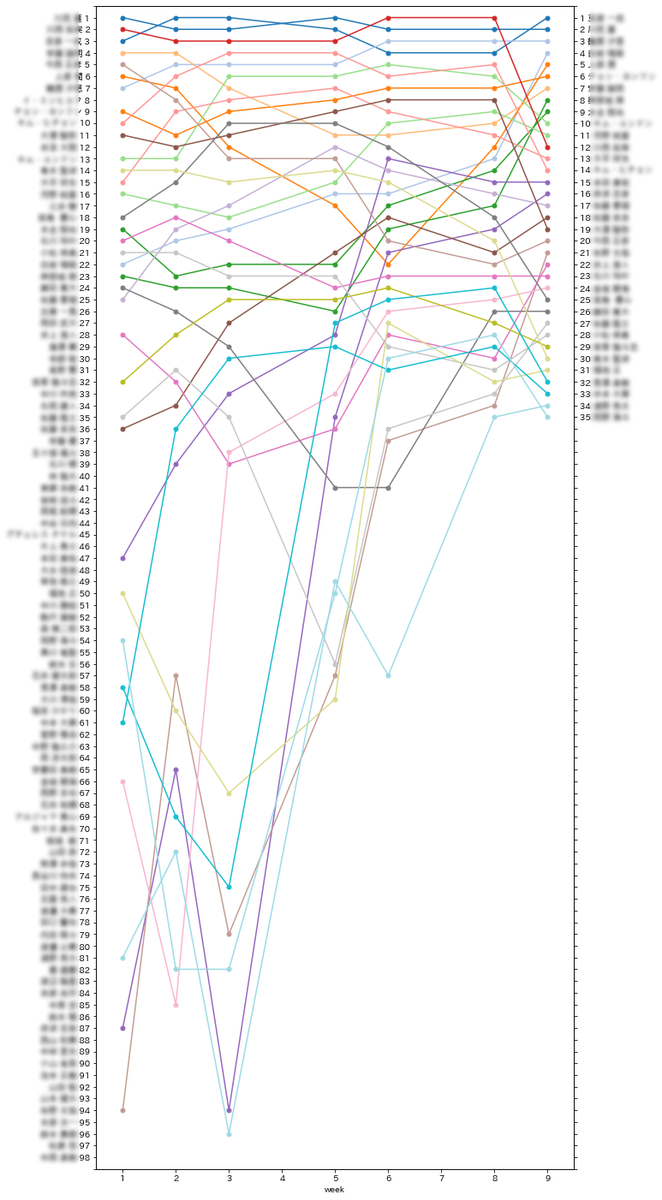
ランキングチャート
ax = df2.T.plot(figsize=(10, 25), xlim = (0.5, week + 0.5), ylim = (100, 0), marker='o', ms=5, legend=False, colormap='tab20')
ax.set_yticklabels(["", *df2.index, ""])
ax.yaxis.tick_right()
ax.set_yticks(list(range(100)))

ランキングチャート(順位・左側全員表示)
ax1 = df2.T.plot(figsize=(10, 25), xlim = (0.5, week + 0.5), ylim = (100, 0), marker='o', ms=5, legend=False, colormap='tab20')
label1 = [f"{name} {i}" for i, name in enumerate(df1.index, 1)]
ax1.set_yticklabels(["", *label1, ""])
ax1.set_yticks(range(100))
ax2 = ax1.twinx()
label2 = [f"{i} {name}" for i, name in enumerate(df2.index, 1)]
ax2.set_ylim(100, 0)
ax2.set_yticklabels(["", *label2, ""])
ax2.set_yticks(range(100))


