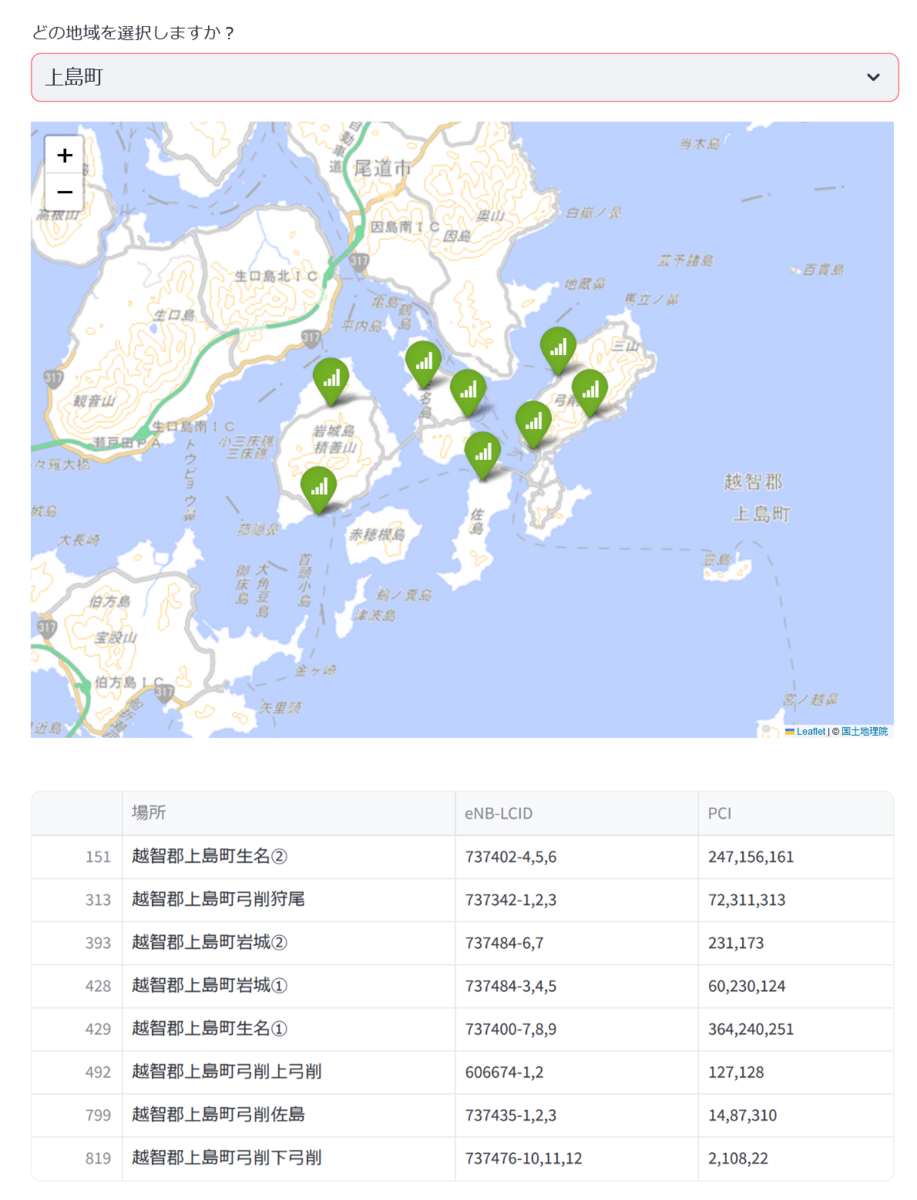
import folium
import pandas as pd
import streamlit as st
from pyproj import Geod
from streamlit_folium import st_folium
df0 = pd.read_csv("https://raku10ehime.github.io/map/ehime.csv")
ehime = [
"今治市",
"新居浜市",
"西条市",
"四国中央市",
"上島町",
"松山市",
"伊予市",
"東温市",
"久万高原町",
"松前町",
"砥部町",
"宇和島市",
"八幡浜市",
"大洲市",
"西予市",
"内子町",
"伊方町",
"松野町",
"鬼北町",
"愛南町",
]
option = st.selectbox("どの地域を選択しますか?", ehime)
df1 = df0[df0["市区町村"] == option][["場所", "緯度", "経度", "eNB-LCID", "PCI", "color", "icon"]]
df1 = df1.rename(columns={"緯度": "lat", "経度": "lng"}).copy()
lat, lng = df1["lat"].mean(), df1["lng"].mean()
m = folium.Map(
location=[df1["lat"].mean(), df1["lng"].mean()],
tiles="https://cyberjapandata.gsi.go.jp/xyz/pale/{z}/{x}/{y}.png",
attr='© <a href="https://maps.gsi.go.jp/development/ichiran.html">国土地理院</a>',
zoom_start=12,
)
for _, row in df1.iterrows():
folium.Marker(
location=[row["lat"], row["lng"]],
popup=folium.Popup(f'<p>{row["場所"]}</p>', max_width=300),
tooltip=row["場所"],
icon=folium.Icon(color=row["color"], icon=row["icon"]),
).add_to(m)
st_data = st_folium(m, width=700, height=500)
if st_data:
bounds = st_data["bounds"]
center = st_data.get("center", {"lat": lat, "lng": lng})
southWest_lat = bounds["_southWest"]["lat"]
southWest_lng = bounds["_southWest"]["lng"]
northEast_lat = bounds["_northEast"]["lat"]
northEast_lng = bounds["_northEast"]["lng"]
filtered_df = df1.loc[
(df1["lat"] >= southWest_lat)
& (df1["lat"] <= northEast_lat)
& (df1["lng"] >= southWest_lng)
& (df1["lng"] <= northEast_lng)
].copy()
grs80 = Geod(ellps="GRS80")
filtered_df["distance"] = filtered_df.apply(
lambda row: grs80.inv(center["lng"], center["lat"], row["lng"], row["lat"])[2], axis=1
)
filtered_df.sort_values("distance", inplace=True)
df2 = filtered_df[["場所", "eNB-LCID", "PCI", "distance"]]
st.dataframe(df2, width=700)
